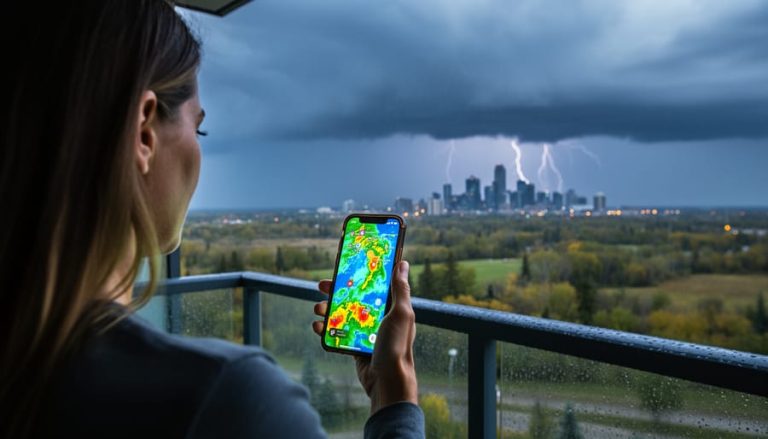
Air quality in Kamloops measures the concentration of pollutants in the outdoor air and tells you whether it’s safe to breathe during your daily activities. Right now, the Kamloops Federal Building is reporting an Air Quality Index of 30, labeled “Good,” which means the air is clean and ideal for any outdoor plans you have in mind.
Understanding what those numbers mean can help you protect your health, plan your workouts, and decide whether it’s safe for kids to play outside or whether vulnerable family members should stay indoors. The AQI scale runs from 0 to 500, with lower numbers indicating cleaner air. Anything under 50 falls into the “Good” category, where even sensitive groups can breathe easy.
British Columbia’s Air Quality Monitoring Agency tracks several pollutants throughout the day, including fine particulate matter (PM2.5), ground-level ozone, nitrogen dioxide, and sulfur dioxide. Each of these can affect your lungs and heart differently, so the monitoring system measures them separately before calculating an overall index. The data updates regularly, most recently on Tuesday at 23:00, giving you near real-time information to guide your decisions.
This article breaks down how air quality monitoring works in Kamloops, what each pollutant means for your health, and how to use the daily readings to make smarter choices about outdoor activities.
What Air Quality Means for Kamloops Residents

Air quality measures the cleanliness of the air we breathe, tracking pollutants that can affect your health and comfort. In British Columbia, the Air Quality Health Index system turns complex monitoring data into a simple 1-10 scale that tells you at a glance whether it’s safe to head outdoors.
The BC Air Quality Monitoring Agency operates this system, collecting readings from stations across the province. When you check the numbers for Kamloops, you’ll see categories ranging from Low (1-3) through Moderate (4-6), High (7-10), and Very High (above 10). Each category comes with specific health advice tailored to your activity level and risk factors.
Understanding the terminology helps you make sense of the readings:
- AQI (Air Quality Index)
- A number from 0-500 that summarizes pollution levels, with lower numbers meaning cleaner air.
- AQHI (Air Quality Health Index)
- British Columbia’s 1-10 scale that translates pollution data into health risk guidance for residents.
- PM2.5
- Tiny particles smaller than 2.5 micrometers that can travel deep into your lungs, often from vehicle exhaust or wildfire smoke.
- O3 (Ozone)
- Ground-level ozone that forms when sunlight reacts with pollutants, causing respiratory irritation on hot summer days.
- NO2 (Nitrogen Dioxide)
- A gas produced mainly by vehicles and industrial activities that can aggravate asthma and reduce lung function.
- SO2 (Sulfur Dioxide)
- A pollutant from fuel combustion that can trigger breathing problems, especially during exercise.
Right now, Kamloops sits at Low (1-3), which means you can enjoy your usual outdoor activities without concern. The official health message is clear: ideal air quality for outdoor activities. Whether you’re planning a morning jog along the river or an afternoon at the park with your kids, these Low readings give you the green light to breathe easy.
How Air Quality Is Measured in Kamloops
Kamloops tracks its air quality through a permanent monitoring station at the Kamloops Federal Building. This station houses specialized sensors that continuously sample the surrounding air, measuring concentrations of specific pollutants including fine particulate matter (PM2.5), ground-level ozone, nitrogen dioxide, and sulfur dioxide.
The sensors work around the clock, analyzing air samples and transmitting raw data to the British Columbia Air Quality Monitoring Agency. Think of these devices as sophisticated air sniffers, they draw in samples, run them through detection chambers, and record precise measurements of each pollutant type. The equipment is calibrated regularly to ensure accuracy, and the data flows continuously to provincial servers.
Once collected, the raw measurements go through a processing system that converts pollutant concentrations into the Air Quality Health Index numbers you see on public websites. The BC Air Quality Monitoring Agency validates the data, checks for anomalies, and formats it into the easy-to-read scale. You’ll see readings updated on a regular schedule, with the most recent data posted at specific times, current information shows updates at Tuesday 23:00, for example.
This processing step is crucial. Instead of presenting you with micrograms per cubic meter of PM2.5, which means little to most people, the system translates those technical measurements into actionable guidance. An AQI reading of 30, like Kamloops currently shows, tells you at a glance that air quality is Good without requiring a chemistry degree to interpret.
The entire cycle from sensor detection to public posting typically happens within hours, giving residents near-real-time information to plan their day.
Understanding the Pollutants Tracked

Kamloops air quality monitoring tracks four key pollutants, each telling a different story about what’s in the air you breathe. Understanding these components helps you interpret the numbers and make informed decisions about outdoor activities.
The current readings at Kamloops Federal Building break down like this:
- PM2.5 (AQI 30): Tiny particles from vehicle exhaust, wood smoke, and industrial processes that can penetrate deep into your lungs
- Ground-level ozone or O3 (AQI 30): Forms when sunlight reacts with emissions from cars and industry, typically higher on sunny summer days
- Nitrogen dioxide or NO2 (AQI 73): Comes primarily from vehicle tailpipes and power plants, irritating airways even at moderate levels
- Sulfur dioxide or SO2 (AQI 0): Released by burning fossil fuels, particularly coal and oil, though currently undetectable in Kamloops
PM2.5 deserves special attention because these microscopic particles measure 2.5 micrometers or smaller, roughly thirty times finer than a human hair. They bypass your body’s natural filters and reach your bloodstream. Wildfire smoke is a major PM2.5 contributor in British Columbia, which is why readings can spike dramatically during summer fire season even when the sky looks clear.
The NO2 reading of 73 sits higher than the other pollutants but remains well within safe ranges. You’ll notice NO2 levels rise during rush hour along Highway 1 and downtown corridors where traffic concentrates. It creates that brownish haze you sometimes see over busy intersections.
Ozone behaves differently than other pollutants because it’s not directly emitted. It forms through chemical reactions requiring heat and sunlight, so readings peak on hot afternoons rather than during morning commutes. You can check AQHI forecast data to see predicted ozone spikes before planning afternoon activities.
The zero SO2 reading reflects Kamloops’ limited heavy industrial activity compared to coastal port cities or areas with coal-fired power generation.
What the Numbers Mean for Your Daily Activities
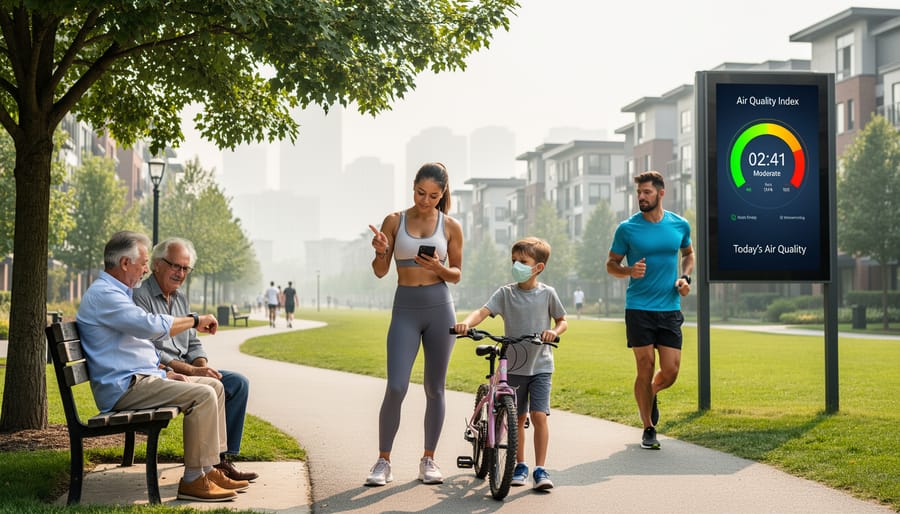
When Kamloops shows a Low (1-3) AQHI reading like today’s 30, the message is straightforward: enjoy your usual outdoor activities. This ideal air quality means you can go for a run, let the kids play outside, or plan a hike without worrying about breathing issues. The reading gives you confidence to schedule outdoor plans for the day.
For most residents, a Good air quality day requires no special precautions. You don’t need to alter your exercise routine, cut short your morning jog, or keep windows closed. The Low health message signals that air pollution won’t interfere with your normal lifestyle, whether you’re commuting by bike, working in the yard, or taking your dog for a walk.
At-risk individuals get different guidance even on good air quality days. If you have asthma, COPD, or heart disease, you’ll want to monitor how you feel during outdoor activities and be ready to reduce intensity if you notice any symptoms. Parents with young children and caregivers of elderly family members should pay closer attention during wildfire season when readings can shift quickly from Good to Moderate.
Similar to Vernon air quality monitoring, Kamloops residents can check current readings before heading out each day. The British Columbia Air Quality Monitoring Agency updates data regularly, with the most recent Kamloops reading posted Tuesday at 23:00. Bookmark the BC Air Quality website on your phone so you can glance at the number before making outdoor plans, especially during summer months when conditions change faster.
Reading Air Quality Graphs and Data
The BC Air Quality website presents data through color-coded charts that make monitoring straightforward once you know what to look for. Green indicates good air quality (like Kamloops’ current AQI of 30), yellow signals moderate levels, orange means unhealthy for sensitive groups, and red warns of unhealthy conditions for everyone. These colors appear both as background shading on graphs and as status indicators beside pollutant readings.
When viewing historical data, look at the trend line’s slope rather than fixating on individual spikes. A steady horizontal line in the green zone means consistent good air quality, while an upward climb into yellow or orange suggests worsening conditions that might affect your plans. The website displays readings updated at specific times, you’ll see timestamps like Tuesday 23:00 showing when measurements were taken, so refresh the page periodically rather than relying on cached data.
Air quality radar maps complement the numerical graphs by showing smoke and pollution movement across regions, helping you predict whether conditions might change based on wind patterns. For daily planning, check the 24-hour graph in the morning: if PM2.5 and ozone levels stayed flat overnight in the green zone, you’re likely safe for outdoor activities throughout the day. Compare today’s peak readings to yesterday’s, if numbers are climbing day-over-day even within the green range, pay closer attention during wildfire season.
How The Air Quality in Kamloops Works
Air quality monitoring in Kamloops works through a continuous cycle of measurement, calculation, and public reporting. At the Kamloops Federal Building monitoring station, sensors sample the outdoor air every few minutes, capturing concentrations of key pollutants like fine particulate matter, ground-level ozone, nitrogen dioxide, and sulfur dioxide. These instruments use optical and chemical detection methods to count particles and measure gas concentrations in real time.
The raw data flows to the British Columbia Air Quality Monitoring Agency, where computers apply standardized formulas to convert pollutant concentrations into individual Air Quality Index scores. Each pollutant gets its own number, right now, PM2.5 sits at 30, ozone at 30, nitrogen dioxide at 73, and sulfur dioxide at 0. The system then picks the highest single-pollutant score to represent overall air quality, which currently stands at 30 (Good) for Kamloops.
The agency updates public-facing numbers throughout the day, with the most recent reading posted Tuesday at 23:00. This regular refresh ensures residents see current conditions rather than stale data. The entire process, from air sample to published number, typically takes under an hour, giving you near-real-time insight into what you’re breathing.
Common Questions About Kamloops Air Quality
How do health messages differ for at-risk individuals versus the general public?
At-risk groups, including children, seniors, pregnant women, and people with heart or lung conditions, receive additional caution messages even when the general public sees a Low risk rating. While the current Low (1-3) reading tells most residents to enjoy usual outdoor activities, vulnerable individuals should still watch for symptoms and adjust their plans if they feel unwell.
How often is the air quality data updated?
The British Columbia Air Quality Monitoring Agency updates readings hourly from the Kamloops Federal Building station. The most recent update came Tuesday at 23:00, and new data appears automatically on the provincial website throughout the day.
What causes air quality to change?
Weather patterns, wildfire smoke, vehicle emissions, and industrial activity all shift pollutant levels. Wind speed and direction matter too, calm days trap pollution near ground level, while breezy conditions clear the air.
Where can I find real-time readings?
Visit for current Kamloops data directly from the provincial monitoring network. Similar resources exist for other BC communities, including Penticton air updates for those tracking conditions across the interior.
These questions cover the practical concerns most Kamloops residents have when checking air quality. The monitoring system runs continuously, so you’re never working with stale information, refresh the provincial page anytime to see the latest numbers from the Federal Building station. During wildfire season especially, checking twice daily helps you plan workouts, kids’ playtime, or evening walks when conditions shift rapidly.
Kamloops is currently enjoying good air quality, with an AQI of 30 that makes it ideal for all outdoor activities. While conditions are favorable now, air quality can shift quickly during wildfire season or weather changes, so checking the BC Air Quality website regularly helps you plan ahead. Have you adjusted your daily routine based on air quality readings, or noticed patterns during smoky periods? Share your experiences and tips with fellow southern Alberta readers on Calgary Now’s interactive platform.